Adelphi is one of the top universities in New York and provides students with a uniquely personalized approach to learning. We’re dedicated to transforming students’ lives through world-class academics, a focus on student success, and a warm and inclusive community.
Facts About Adelphi
View Adelphi’s current enrollment statistics and demographics.

Top-Ranked Private University on Long Island, New York
Adelphi jumped an impressive 119 spots on the 2025 Forbes Top Colleges list—one of the biggest leaps nationwide. The ranking recognizes Adelphi's success in empowering students from all backgrounds to achieve their career and life goals.
A Nationally Recognized Institution
Adelphi is a strongly ranked, powerfully connected university offering 120-plus exceptional undergraduate and graduate programs through eight schools and colleges.
Founded in 1896, we were the first private, coeducational university on Long Island. Today, our main campus in Garden City and our dynamic learning hubs in Manhattan, the Hudson Valley, Suffolk County and online are a home away from home to 8,000 students from across the United States and around the world.
You can learn more about us, our history and how our students succeed throughout the Meet Adelphi section. Here are a few places to get you started:
The people I was surrounded by certainly made my education one of a kind. I found peers and professors who were attentive and cared about my struggles and my future.
 Gabi Vidad ’21
BS in Physics, Honors College, whose thesis on coral reef mapping won several awards
Gabi Vidad ’21
BS in Physics, Honors College, whose thesis on coral reef mapping won several awards
Around Adelphi
Scenery. History. Community. Take a look around our picturesque main campus and our other locations in the New York metropolitan region. Launch Gallery
Around Adelphi
Scenery. History. Community. Take a look around our picturesque main campus and our other locations in the New York metropolitan region. 8 Photos-

Nexus Building
-
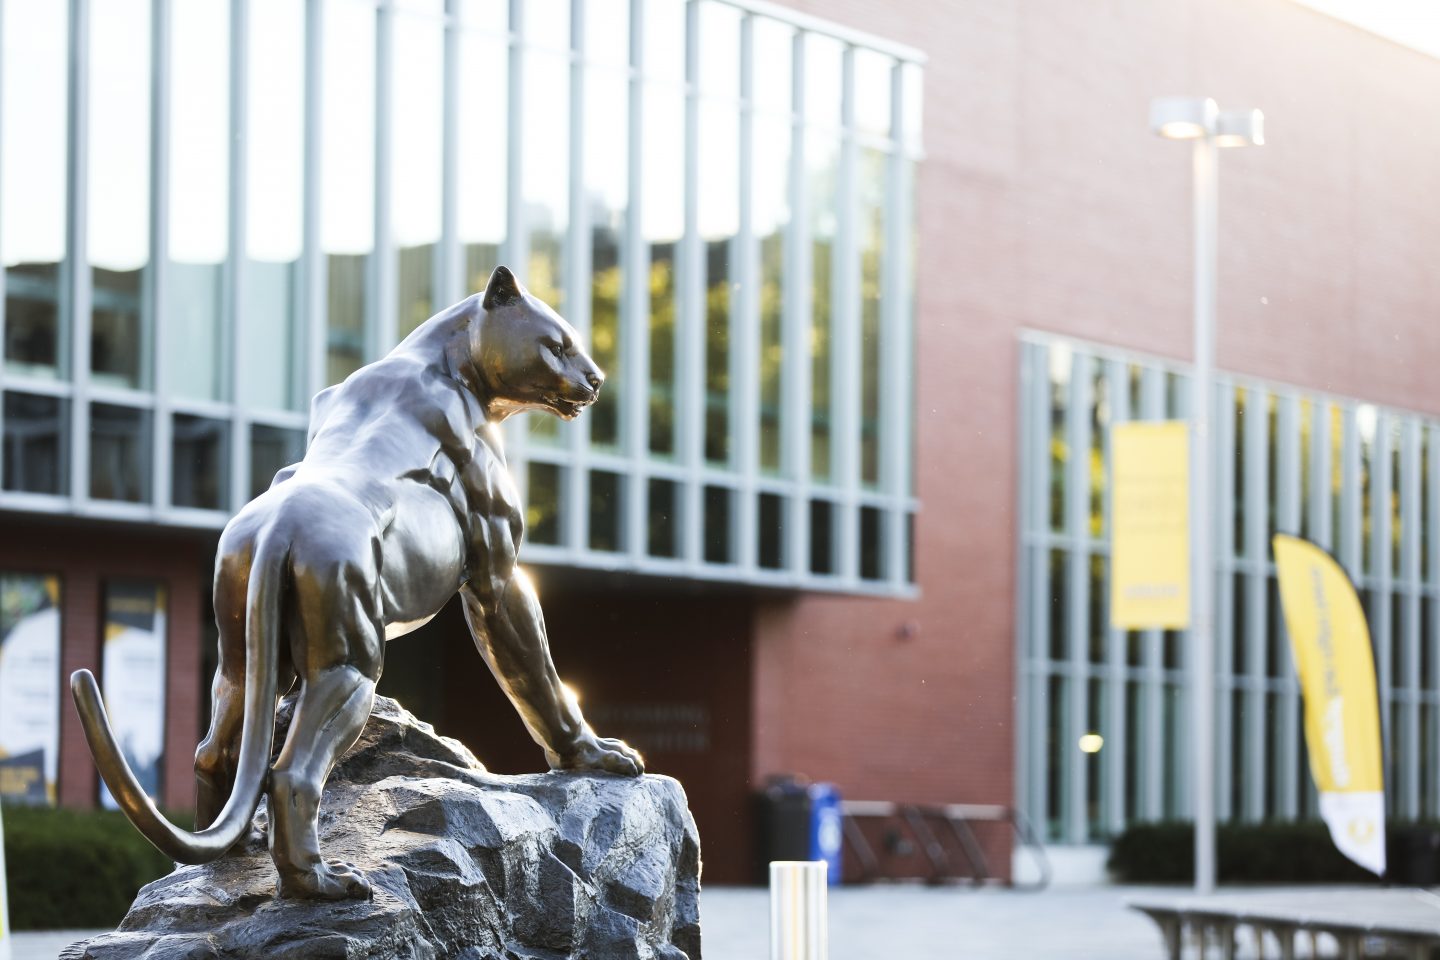
Panther Statue, Garden City Campus
-
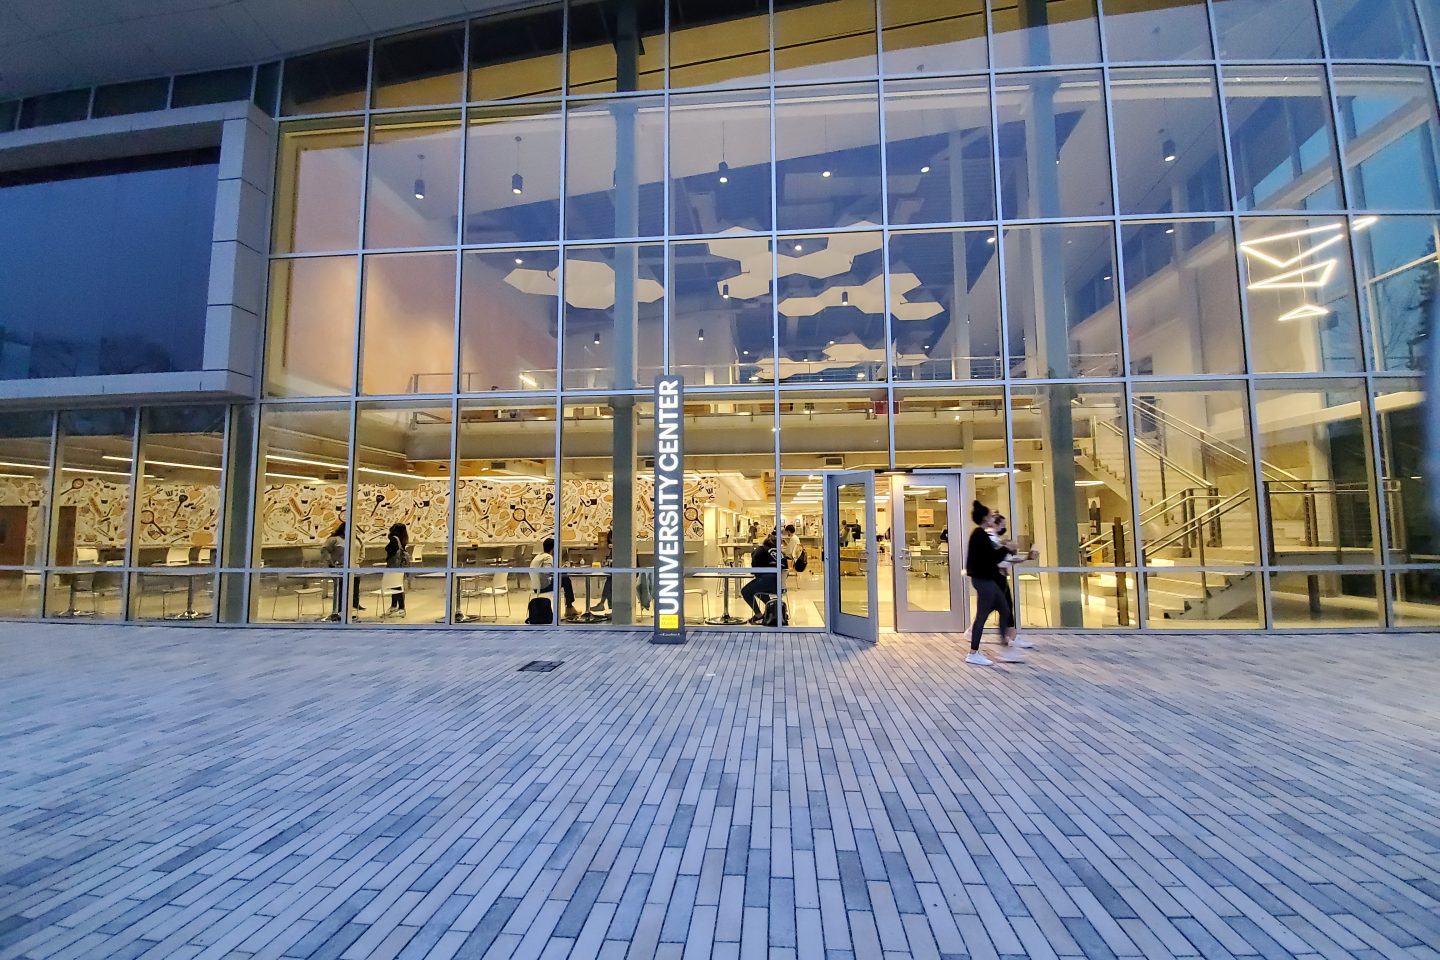
Ruth S. Harley University Center
-

Jones Beach Long Island
-
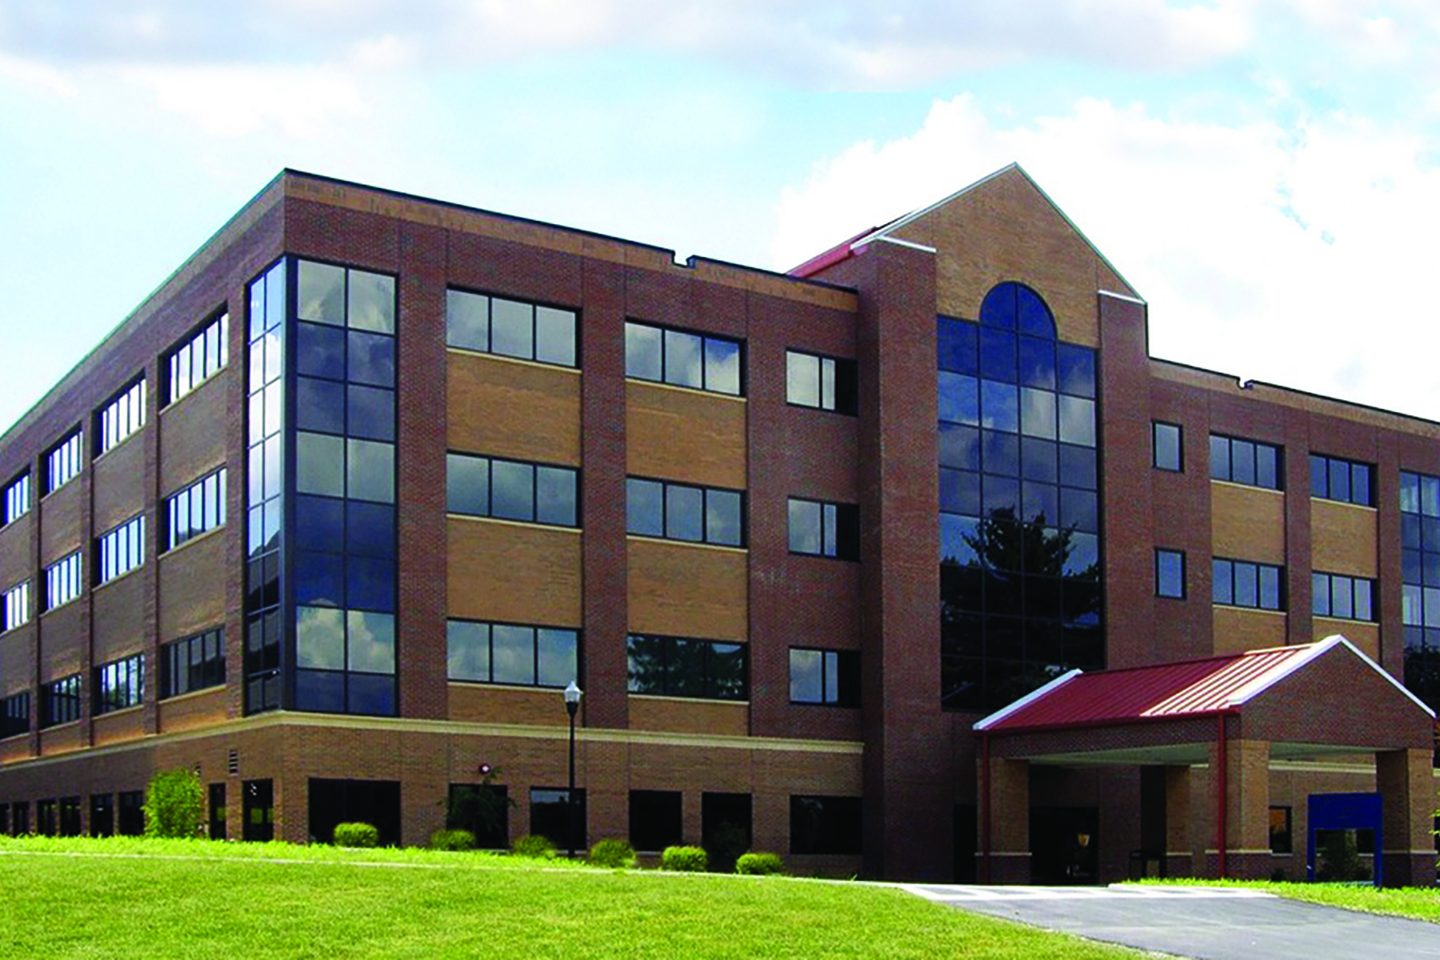
Hudson Valley Center
-

Hudson Valley New York
-

Garden City New York
-

New York City
FAQs About Adelphi University
“Adelphi” is pronounced uh-DEL-feye (phonetic: /əˈdɛlfaɪ/).
Breakdown:
- uh: Sounds like the ‘a’ in “above”.
- DEL: Rhymes with “spell” or “bell”.
- feye: Sounds like ‘fye’ (rhymes with “eye” or “sky”).
- uh-DEL-feye
Adelphi’s Garden City campus is located on Long Island, NY, and encompasses 75 beautiful acres.
Smaller, specialized facilities, offering program-specific courses, are located in the Hudson Valley, Suffolk County and New York City. In addition to our on-campus programs, Adelphi reaches many students through our online programs.
Adelphi is a small school with a national reputation and acclaimed programs in business, nursing, psychology and social work.
The University is regularly ranked among top schools on Long Island by Forbes and U.S. News & World Report, as well as being cited as a best college for veterans and a top performer on social mobility.
Adelphi is a private university dedicated to the success of all students, with all full-time undergraduate students receiving financial aid.
Originally founded as Adelphi Academy in Brooklyn in 1863, it was chartered as Adelphi College in 1896. The institution later relocated to Garden City, NY, in 1929 and, as outlined in our history and timeline, is recognized as the first private coeducational institution of higher education on Long Island.
Yes. Adelphi offers on-campus housing in seven residence halls, and many undergraduate students live on campus. The residence halls provide housing options based on lifestyle, academics, and degree level. Each hall is supported by professional, full-time staff and an elected hall council representing the residential community.
Adelphi’s Panthers compete in NCAA Division II and are in the Northeast 10 (NE10) Conference. The women’s bowling team is part of the East Coast Conference (ECC). The University fields 23 varsity sports programs.
Focused on Outcomes