Beth Christensen, Ph.D., shares her collaborative research experience mapping the sea floor near Fire Island in the aftermath of Superstorm Sandy.
Most New Yorkers dream of taking a winter cruise to the Caribbean or Florida. Instead, in the middle of winter, I found myself on an 80-foot ship sharing a bunk room and head with one woman and eight men, sailing back and forth in front of the Fire Island Lighthouse. Why? Because Superstorm Sandy devastated the New York and New Jersey coastlines, destroying homes, flooding vast regions and altering beaches. While the damage on land is clear, the impact to the estuarine and shallow coastal system is less obvious. So, off we went, mapping and sampling the seafloor in the coastal zone and in the bays on a Rapid Response project funded by the University of Texas at Austin.
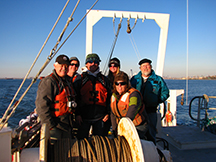 |
| Dr. Beth Christensen and the team aboard the R/V Seawolf. |
We embarked on the Research Vessel (R/V) Seawolf for two weeks. Our team consisted of scientists from New York and Texas: John Goff, Jamie Austin, Steffen Saustrup, Cassandra Browne (University of Texas at Austin Institute for Geophysics) and Roger Flood (Stony Brook University). The R/V Seawolf is owned by Stony Brook University, and the captain, Chris Harter, science leaders Dave Bowman and Mark Wiggins, and deckhands Ed Witkowski, Pat Gorman and Brian Gagliardi were locals who were impacted by Superstorm Sandy.
 |
| A grab sample of sediment. |
Seafloor mapping utilizes two geophysical tools: Compressed High Intensity Radar Pulse (CHIRP) and Multibeam. CHIRP works by sending a sound signal (a bit like a cricket on steroids) to the seafloor—penetrating the seafloor and bouncing back off layers in the sediments—to provide a subsurface image of the seabed up to 10 miles deep. These images allow us to identify areas where waves and currents generated by Sandy may have removed or deposited sediments. The second tool, Multibeam, collects a swath of acoustic data from the seafloor, which, when stitched together, provide an excellent view of the seafloor that resembles a photograph. Multibeam measures both the topography of the seafloor and the acoustic backscatter, which can reveal different sediment types (e.g., mud, sand, gravel).
Although these tools helped us make interpretations about the seafloor, we needed sediment samples. This involved sending a bucket-like device to the seafloor that clamped shut on the sediments, capturing about two liters of sediment (and the occasional sand dollar). In charge of sediments, I had the lucky job of scraping it all out of the sampler and into the bags—not so bad when it’s sand, but not so much fun when it’s goopy mud. We also tried to preserve the sediment water interface, to be sure we had the most recent sediments deposited out there. We were lucky in terms of weather—air temperatures were close to water temperatures at about 40 degrees. Our first day mapping we had a rough time of it: Seas swelled and we made it worse by sailing into the waves to maintain a straight course. But we saw some very interesting patterns, beginning early in the trip. Looking at mapping done by the U.S. Geological Survey off Fire Island revealed the storm shifted a lot of sand around offshore. The grab samples and CHIRP indicated Sandy left a thin layer of organic-rich muds draped over the region. We look forward to determining exactly how the seafloor changed, where that mud came from and its composition.
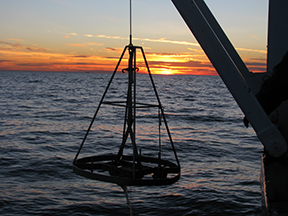 |
| Collecting sediment from the sea floor. |
Understanding Sandy’s impact on our coastal zone will take a lot of time and an enormous amount of effort by many teams of scientists. A second project will follow—nine additional days collecting samples in the western bays and Jamaica Bay—led by the Adelphi environmental studies team (including Jessica Dutton, Christine O’Connell and myself) and funded by the National Science Foundation (NSF).
Although Sandy devastated lives, the bright side is that we can learn so much about the processes associated with massive storms, which policy makers will hopefully integrate into planning. With comprehensive planning and good luck, we will have a coastline that is both beautiful and more predictable.
For further information, please contact:
Todd Wilson
Strategic Communications Director
p – 516.237.8634
e – twilson@adelphi.edu