The Misery Index was introduced in the 1970s as a crude measure of economic adversity, adding together the otherwise incommensurable inflation and unemployment rates.

Robert Goldberg is a James F. Bender Clinical Professor of Finance at the Adelphi University Robert B. Willumstad School of Business.
In a similar spirit, here we introduce a rudimentary measure of monetary accommodation. Our Fed Accommodation Index is the simple sum of two components. The first is the difference between the rates of money supply growth and the growth rate of GDP, where a greater difference would signify “looser” money. The other component is the difference between inflation and the Fed funds rate, where inflation greater than the interest rate suggests insufficient tightening.
A positive index value implies that the Fed is being accommodative, while a negative value implies the opposite. And as we will see, magnitude matters.

Mariano Torras is a Professor and Chair of the Finance and Economics Department at the Adelphi University Robert B. Willumstad School of Business.
The accompanying graph shows changes in the value of the index over more than six decades. The pattern is revealing. From 1959 to the late 1970s, the index mostly remained at a low absolute magnitude, whether positive or negative. But for the 20-year period immediately following, it is nearly always negative, flirting with and even falling below -15 on a few occasions in the late 1970s and early 1980s.
The Fed, in other words, had its foot on the brake from about 1980 to 2000, the effect at least partly a residual from its emphatic response to the double-digit inflation of the 1970s.
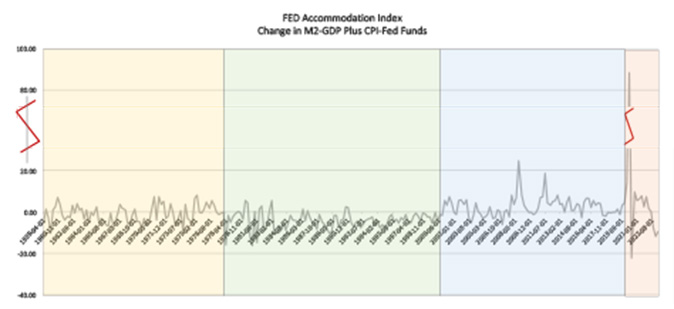
After 2000, however, a starkly different picture emerges. The Index moves into positive territory and, after some fluctuation during the aughts, remains there in the decade or so following the financial crisis. Moreover, it peaks at 25, and then again at 18, both far higher than anything seen in the preceding six decades. What is most remarkable is that the index remains relatively high despite historically low inflation over the period. The pedal was, in other words, “pressing down hard on the metal”, as monetary policy was increasingly relied upon to stimulate an economy no longer responding to fiscal stimulus funded by federal budget deficits. The macroeconomic data certainly seem to bear this out; after growing at an annualized rate of over 3.5 percent from 1947 to 2000, inflation-adjusted US GDP grew only two percent per annum from 2000 to 2020.
Our index also reflects the unprecedented volatility of the early Covid years, and its sensitivity to the emergency measures undertaken. Sharply negative GDP growth in the second quarter of 2020 raised the index to an anomalously high level (88), while the ensuing “correction” did the same in the third quarter but in the opposite direction (-22). And notice how, in response to the recent return of inflation about eighteen months ago, our index shows the United States entering a phase of monetary tightening the likes of which we have not seen in about 40 years.
What the graph cannot, of course, tell us – and it is the critical question on everyone’s mind – is what to expect in the medium to long-term. Is the drop in our index over the past 18 months a mere blip, to be reversed once we re-enter the accommodative regime of persistently low rates – if that is even possible? Or does it perhaps signify entry into a new policy regime of high rates? The short run answer is highly unpredictable. But in the longer term, the path followed by the Accommodation Index will in large part depend on a mix of factors with low uncertainty (e.g., demographics), medium uncertainty (government policy), and high uncertainty (the rate and impact of scientific discovery). It is almost assured that such factors will weigh heavily on future growth and inflation trends and monetary responses.